
Using Dash-Cytoscape to plot Decay Paths of Isotopes
Most of us who are lucky enough to have had a science education would of course be familiar with the periodic table. Last year (2019) was celebrated as the 150th anniversary of the table, dating from the publications of Mendeleev’s table in 1869.
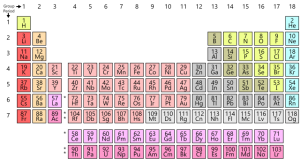
https://en.wikipedia.org/wiki/File:Simple_Periodic_Table_Chart-en.svg
There is another chart, not quite so well-known but common, showing the isotopes of each of the elements.
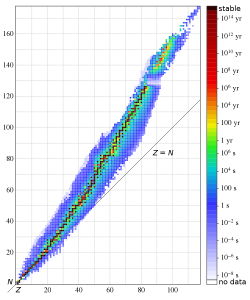
https://en.wikipedia.org/wiki/File:Isotopes_and_half-life.svg
I have had a background hobby of trying to put together some representations of the data. With the COVID-19 slowdowns, I have had the time to assemble this to a Plotly Dash app using the Cytoscape library.
One aspect of the relationship between the isotopes which I don’t believe is readily available is a clear representation of the decay chains. Unstable isotopes will emit or capture particles to achieve a more stable state, transforming into other elements/isotopes. This information is usually embedded in the isotope chart through colour, indicating the nature of the decay but not clearly illustrating what happens next. Additionally, some isotopes have multiple potential decay paths which produce different child isotopes. This is difficult to represent in a simple chart.
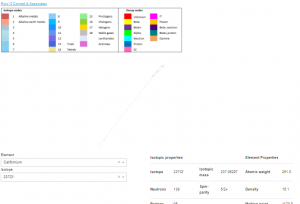
What I present is a list of the decay processes for each isotope. For the purposes of clarity, both the isotopes and the decay type are presented as nodes in the directional graph. Isotopes have a rectangular note, decay nodes are round.
I have kept the controls to a minimum, allowing for the selection of an element and the selection of an isotope of that element. The chart is built showing all upstream and downstream reactions which have the selected isotope in the chain.
I have kept as far as possible to the layout of the isotope chart, which creates a couple of problems. Firstly, for heavier isotopes, the decay chains can be quite long and the initial rendering can appear as a faint diagonal line.
 You can zoom in to those parts of the chain which are of interest.
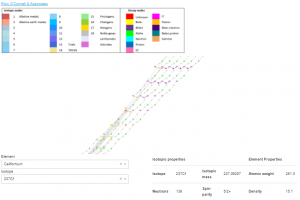
Secondly nuclear isomers overlay each other. Third, the decay nodes sometimes overlay an isotope node, or vice-versa. 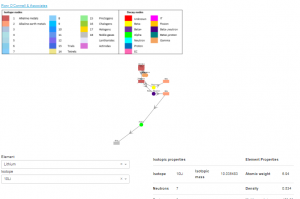 I have added a small x offset to partially disentangle the isomers, but for these issues I believe the fact that the graph is interactive means you can move the nodes around if it isn’t clear what’s happening.
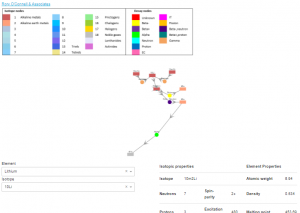
Some notes:
- I haven’t really dealt with Helium in terms of alpha emissions. There is no link in the decay paths back to 4He. Given this is a common decay, the display would I think be overloaded.
- I have used an image for the legend. There are reasons for this which relate to how the legend gets generated from a graph and the fact that there are two different types of nodes which need to be differentiated;
- The data was obtained by scraping Wikipedia. The last cut of data was taken last year, and the value of the information will itself decay with time. I will endeavour to periodically update the information. Meanwhile I think it’s important to keep Wikipedia going, and it runs on donations. I would encourage you to consider helping. https://donate.wikimedia.org/wiki/Ways_to_Give
- Given the nature of the data, it is always going to be incomplete. New elements/isotopes are created, measurements can be unknown or approximate. I have tried to deal with this as follows:
- Where a particle decays to a child, but there is no information on the child, I have recorded the child as unknown;
- Where there are multiple decay paths from a single isotope, but the relative percentages of the alternative paths is unknown, I’ve split them 50:50;
- Approximate values are presented without qualification, as are maximum/minimum values. Don’t try building a reactor based on this data;
- Where there is a difference between data here and what is in Wikipedia, I will happily defer to them.
I hope you enjoy this modest offering. I am planning a couple more visualisations of the data set, and would welcome any feedback you have. Please email me at rory@roconnell.com.